For the March 2021 Climate Change Peer Learning Group, I spent a couple of hours learning about Oil Pricing. This proved far too large a topic to cover in the allotted time, far more so than for any of the other topics I’ve studied in a PLG before. Here’s what I learned.
Learning Trajectory
I started with Wikipedia and some assorted Googling to get the basics of crude oil, shale, natural gas, to get an idea for their rough production levels around the world, and to learn a bit of history about OPEC. Eventually, I landed on this course from PennState: Energy Markets, Policy, and Regulation.
This course is an excellent resource, and I spent about an hour going through the first lesson (of 12), which is about the global market for crude oil. It was well written, interesting, and provided a good not-too-heavy mix of history, geopolitics, and economics to bring me up to speed.
Future lessons promise to cover the markets for refined petroleum products, the markets for natural gas, and then further topics on natural gas, electricity, energy regulations, challenges with adopting renewables, and a number of related econ and finance topics.
If you want a thorough introduction to the topic, check out the course. If you instead want a lighter more enjoyable exploration of the topic, check out Planet Money Buys Oil, a 20-minute episode of NPR’s Planet Money.
Understanding Oil
There’s crude oil, shale oil, and natural gas. Crude oil is found at a depth of about 6000 ft, and requires the most refining of the three to be useful. Shale oil is found at a depth of about 9000 ft. Natural gas is primarily methane, and requires the least work of the three to refine.
Within each of these main categories of oil, there is a large numbers of kinds of oil. Take a look at the futures and indexes listed on these oil price charts to get a sense for how many different kinds of oil trade every day. The two at the top of the charts, West Texas Intermediate (WTI) and Brent, are the most important, as those two serve as benchmark oil prices for the rest.
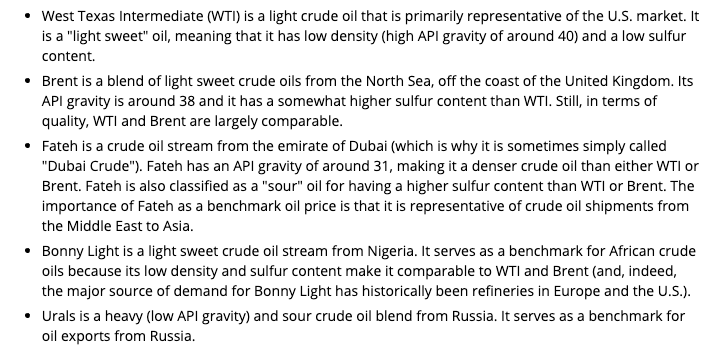
What makes an oil higher or lower quality? Two important dimensions are its sulfur content, and its viscosity. Oils low in sulfur are said to be “sweet”, while those high in sulfur are termed “sour”. The lower the sulfur content, the higher quality the oil. Viscosity of crude oil is measured on the API (“American Petroleum Institute”) gravity scale. Low viscosity oils are called “light”, and high viscosity oils are called “heavy”, with lower viscosity being preferable and more valuable than higher viscosity oils.
WTI is a light sweet oil representative of the US market. Brent is a blend of light sweet crude oils from the North Sea, with just slightly higher levels of sulfur than WTI.
Oil Production Levels
US, Russian, and Saudi Arabia all producing near peak rates 9 to 11 million barrels per day. In the US, that works out to about 1 barrel per person per month. In the Russia, production is about 2 barrels per person per month. And in Saudi Arabia, production is about 10 barrels per person per month. (The differences here come from differences in the nations’ populations, not from their oil production levels, which are all the same order of magnitude.)
I like thinking about production in terms of barrels per person per month because you get nice tangible values that you can compare to your own oil usage. How often do you get gas for your car? How long does it take you to go through a barrel of oil yourself? Far more than a month, I’m sure.
A Wee Bit of History
There were important oil embargos in 1973 and 1979. I’ll summarize what I read about briefly here, but I recommend reading through the course’s text rather than this short summary. In 1973: an unwarranted energy scare leads to the Arab oil embargo. The Middle East countries announce a 5% production cut per month as a reaction to the Yom Kippur war between Egypt and Israel. Though they announced a 5% decrease in production, in practice decreased production less than 1%.
Main takeaway from this event: Cartel coordination is hard! Each country still had an individual profit motive, which prevented the embargo participants from carrying out their stated embargo.
The 1979 embargo: An Iranian worker strike lead to oil prices rising. Again, this was mostly due to speculation not an actual production decrease.
The main takeaways from these two events: Fear of control due to OPEC is just as powerful (perhaps more so) as the actual control exerted by OPEC. More recently, fear of geopolitical instability in the Middle East and Africa has a similar effect. It’s abundantly clear there is so much important history and geopolitics that I haven’t gotten to read about yet.
My Notes
There is lots more from the PennState course. I’ll recommend it one last time for anyone who wants to dive deeper into the subject. This is a massive topic and I spent a little under two hours reading about it. So, there’s much more to learn! To see what else I encountered in my brief foray into the topic, have a look at my notes here on Roam Research. They’re world-readable and world-editable, so feel free to peruse or even make contributions if you’re so inclined.